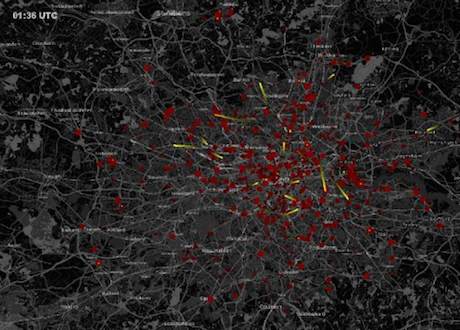
24 Hours of London's Tweets Visualised
This is a fantastic visualisation of 24 hours' worth of tweets across London. It's a great video - and choice material for social media presentations, I'd wager - that brings to life the way information is shared across a geography.
The red dots are the tweets, with the yellow streaks showing the direction of a retweet (RT) from the origin to the destination. Of course, this is just a fraction of the actual volume as most people don't have geolocation turned on.
The gold star for this goes to Dr Anders Johansson (@afjohansson) at the Centre for Advanced Spatial Analysis, University College London. From a quick peruse of his research, there's some interesting work at UCL that worth keeping an eye on.
Hat tip: LikeCool.com
Topic:


